Setups for Tuesday, October 13
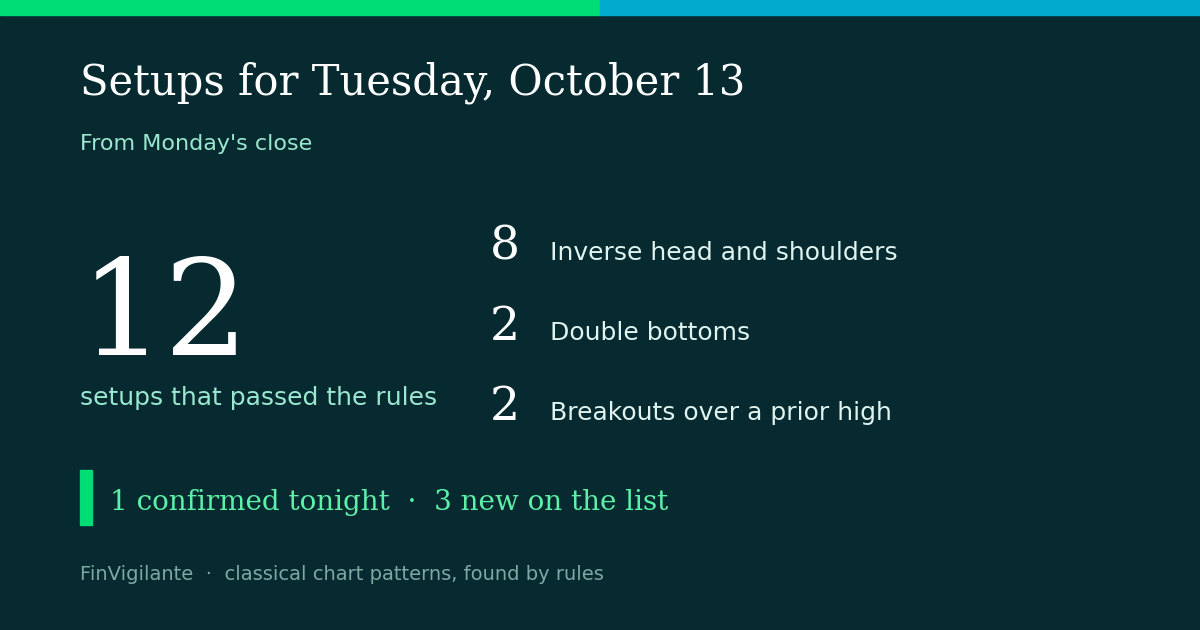
From Monday's close: 12 setups with trigger, stop and target.

Patterns the scan found at Monday's close, October 12, in the order we'd look at them. ★ marks names we were already watching. The line is the neckline or ceiling; the trigger is a close half an ATR past it. A name is approaching until it closes over the line, over the line but not confirmed until it closes past the trigger, and confirmed after that. Stops follow the Last Day Rule, so a name still approaching shows no stop or R:R. Negation is the level that says the pattern failed (the right shoulder or the second low); the shaded band on the chart is the target area, 80 to 100 percent of the measured move. Full method: finvigilante.com/rules.
The market at the close
Breadth counts cover the stocks we scan. Uptrend, narrow: SPY is above its averages but fewer than 55% of stocks are above their 200-day: the index is up, most stocks are not. Breakouts outside the leaders fail more often; prefer names with strong relative strength.
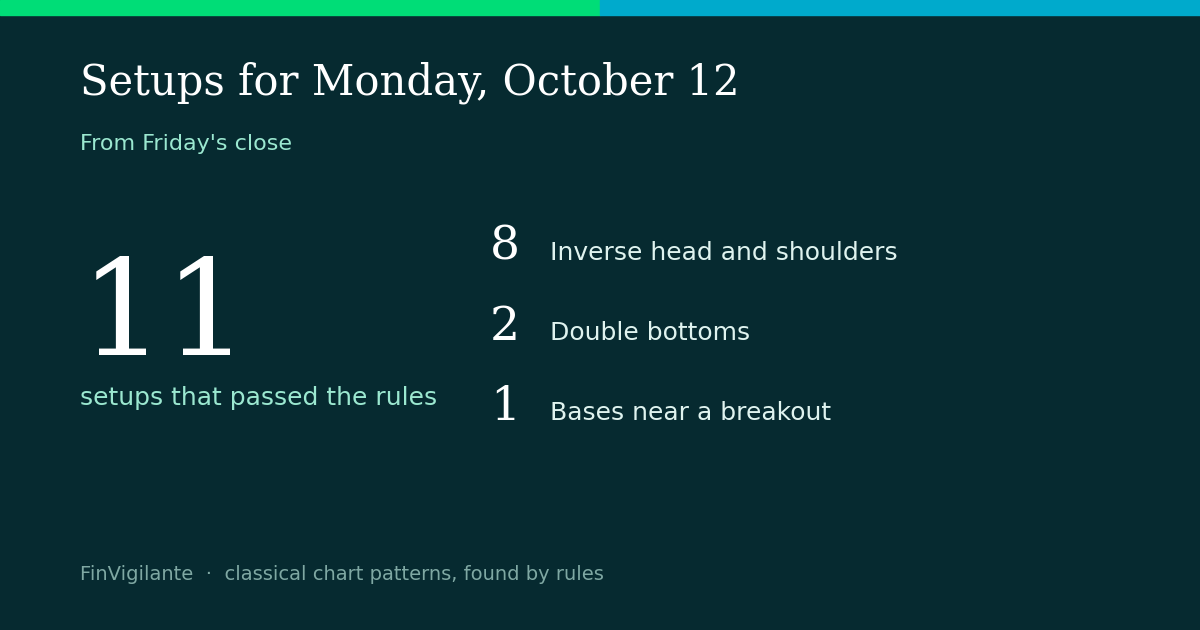
At Monday's close the rules passed 12 names across 3 patterns: inverse head and shoulders, double bottoms, breakouts over a prior high.