
Double Bottom: the Rule, the Levels, a Real Example
The rule we use to find it in 2,000 stocks every night, the four levels, and one real example.
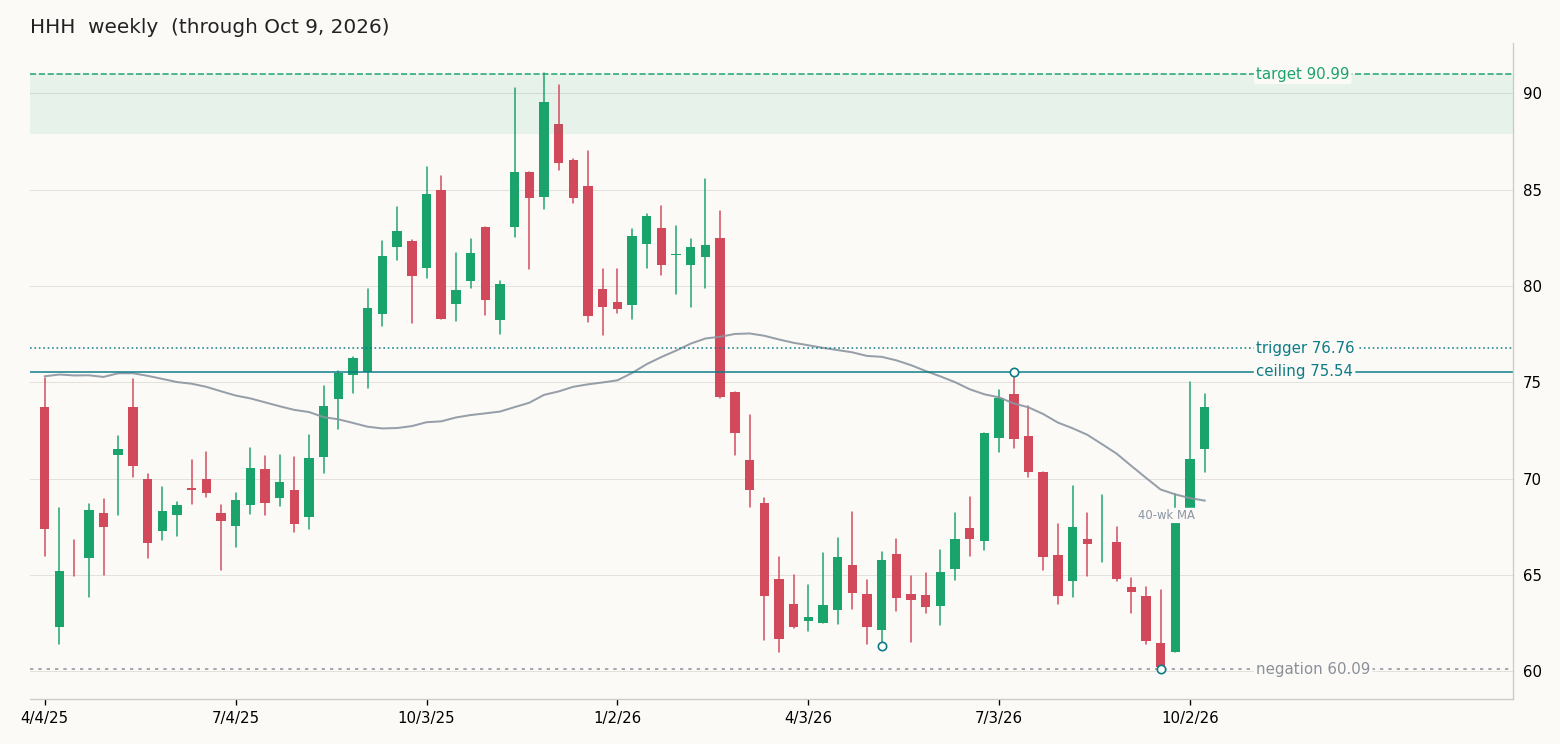
A double bottom is two lows at about the same price, weeks apart, with a horizontal line, the ceiling, across the high between them. It is simpler than an inverse head and shoulders and fails more often when it is called early, because every pullback to an old low looks like one until the ceiling breaks. This page is the rule we use to find it in about 2,000 US stocks after every close, and one real example from the nightly letter.
The rule
What has to be there
Read on weekly bars. Two lows within a few percent of each other, several weeks apart, and a horizontal ceiling at the high between them. The pattern has to be at least 12% tall relative to the ceiling. The second low has to have held: a close under it ends the setup. A double bottom that follows a decline is a bottom; the same shape inside an uptrend is a continuation, and we label it that way.
What disqualifies it
- The lows are only days apart. Two lows a week apart are one low with a bounce in the middle; we want them several weeks apart.
- The second low undercut the first by more than a few percent. That is a lower low, not a double bottom.
- The ceiling has to be tilted to make the breakout happen sooner. We draw it horizontal at the high between the lows, or not at all.
- The stock is under a falling 200-day average. A bottom fighting a falling long-term average is a short-covering rally more often than a trend change.
- It already broke out once. A second trip through the same ceiling is a re-test, not a fresh breakout.
The four levels
Every double bottom in the letter is published with the same four numbers.
- Line. The ceiling, horizontal, at the high between the two lows.
- Trigger. A daily close at least half an average true range (10-day) above the ceiling. A fixed 3% treats a utility and a biotech the same; half an ATR scales with how the stock moves.
- Stop. Under the low of the last day that traded entirely inside the pattern before the first close over the ceiling. That is Peter Brandt's Last Day Rule as Aksel Kibar applies it. The day does not exist until the breakout happens, so a name that is still approaching shows no stop.
- Target. The measured move: the height from the lows to the ceiling, added to the ceiling. The shaded band on each chart is 80 to 100 percent of that move.
The fifth number is negation: a close under the second low ends the setup, whether or not it ever triggered.
A real one: Howard Hughes Holdings, October 2026
This is the block paid members saw on Monday, October 12, built from Friday's close. First low 61.32 in early May, second low 60.09 in mid September, nineteen weeks apart, ceiling at the July high of 75.54.
The second low undercut the first by two percent, which is inside the tolerance; a bigger undercut would have been a lower low and no pattern. The height is 20% of the ceiling, so the target sits at 91. There is no stop yet because the stock has not closed over the line; it appears the night it does.
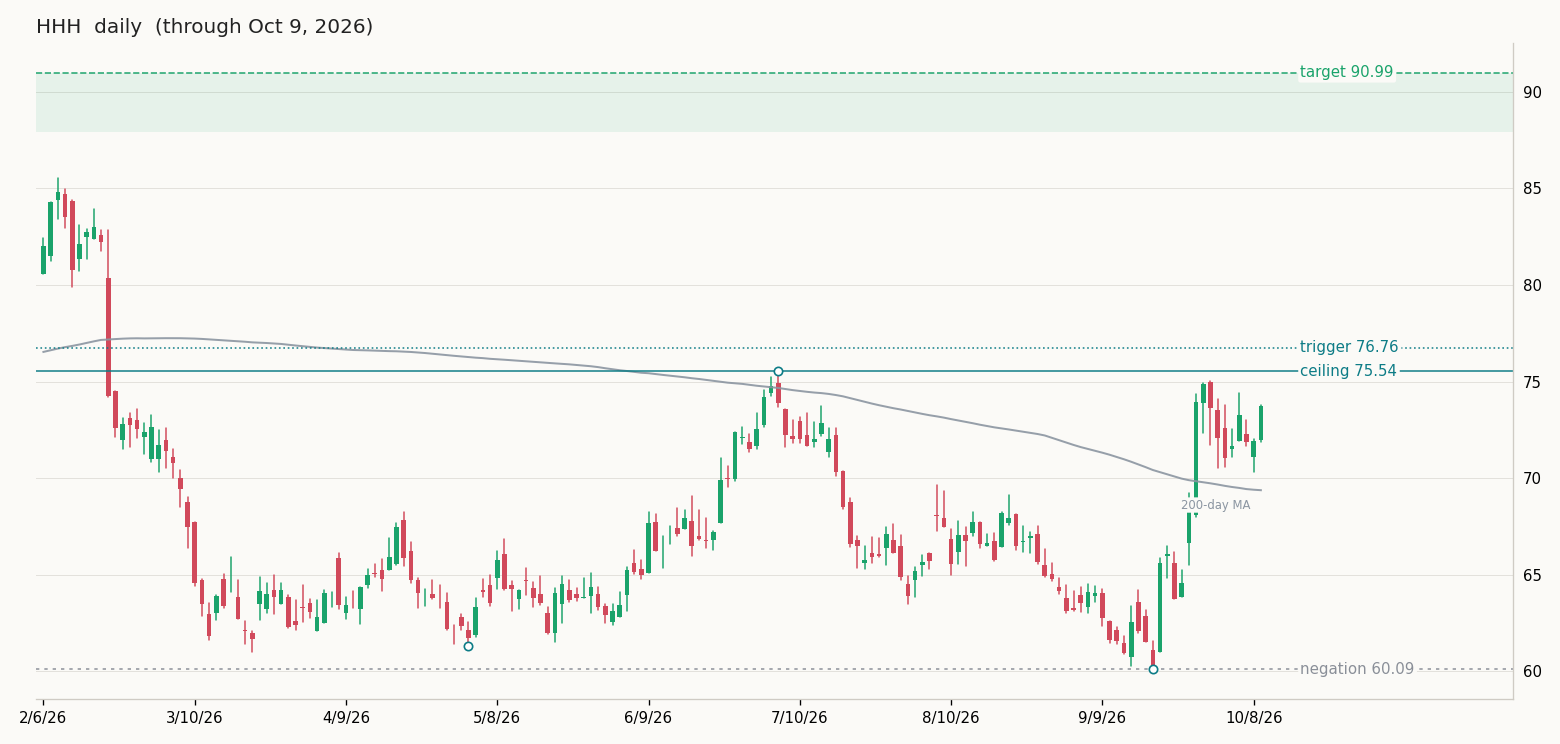
Whether HHH confirms is not the point of this page. The point is that every name in the letter is measured exactly this way, the same night, with the same rule, and the list remembers what it said: a confirmation, a target hit or a negation is reported the night it happens.
Where the rule comes from
Edwards and Magee described the pattern in 1948 and warned that most double bottoms are not: the second low has to be weeks away from the first, not days. Bulkowski sorted them by the shape of each low and measured them; his best-performing variety, the Eve and Eve double bottom with two rounded lows, reached its measured target 65% of the time in bull markets across 952 patterns, with a 12% break-even failure rate and a 65% throwback rate (source). Brandt added the Last Day Rule for the stop and the discipline of waiting for the close. The full list of rules, with each author credited, is on the How the scan works page.
Questions
How far apart do the lows have to be?
Several weeks. Our scan requires it; the HHH example is nineteen weeks. Lows a few days apart are one low.
Does the second low have to match the first exactly?
No. Within a few percent either way. A second low slightly above the first is common and fine; one well below it is a lower low.
Daily or weekly chart?
Weekly to find it, daily to time the entry. The letter shows both for every name.
How is this different from an inverse head and shoulders?
Two lows instead of three, and no head below the shoulders. The levels are measured the same way. The inverse head and shoulders page has that rule.
Can I see tonight's list?
The full list is for paid members, $10 a month. The free Sunday recap shows what fired, what reached its target and what was negated during the week, and the three names closest to a breakout.