
The Last Day Rule: Where the Stop Goes on a Breakout
Brandt's stop rule, the plain version we use, and a worked example from the letter.
The Last Day Rule is Peter Brandt's answer to the oldest question in breakout trading: where does the stop go? His answer is under the low of the last day that traded entirely inside the pattern before the breakout. Not a percentage, not an ATR multiple, not a round number. A level the chart itself drew, on a day you can point to. Every stop in the FinVigilante letter is set this way.
The rule
Where the stop goes
Find the first daily close over the pattern's line. Walk back from it to the last completed day whose whole bar, high to low, sat inside the pattern. The stop goes a fraction under that day's low. Days that poked above the line intraday but closed back inside do not count; they were not entirely inside.
Why it works
- It is the last price the pattern defended before buyers took the line. If price trades back under it, the breakout is not a breakout.
- It is close. A breakout that is real usually never looks back at that day, so the stop is tight without being inside the noise.
- It is fixed before the trade. There is nothing to decide in the moment and nothing to argue with at 3:55 pm.
- It scales with the stock. A volatile name has wider days and a wider stop; a quiet one a tighter stop. No multiplier needed.
How we apply it
We use the plain version, as Aksel Kibar applies it week after week on global stocks: the last day entirely inside the pattern, before the first close over the line. The stop is placed 0.2% under that day's low to sit beneath the obvious level.
Brandt's own practice has evolved. In his newer work he will use the breakout day's low when at least half of that bar was below the line, and sometimes the breakout day's open, to get a tighter stop (his Q&A on the rule). We tried the breakout-day amendment and dropped it: on a stock that gaps through the line it produces a stop that reads off nothing, and the plain rule reads straight off the chart.
Two consequences follow from the rule, and both show up in the letter.
- No stop until the breakout. The last full day inside the pattern is not known until there is a close over the line, so a name that is still approaching shows "stop set at breakout" and no reward to risk. The stop appears the night of the first close over the line.
- The stop never moves down. It is tied to a day that already happened. It can be raised as the trade works; it is never lowered to give a losing breakout more room.
A real one: Kohl's, October 2026
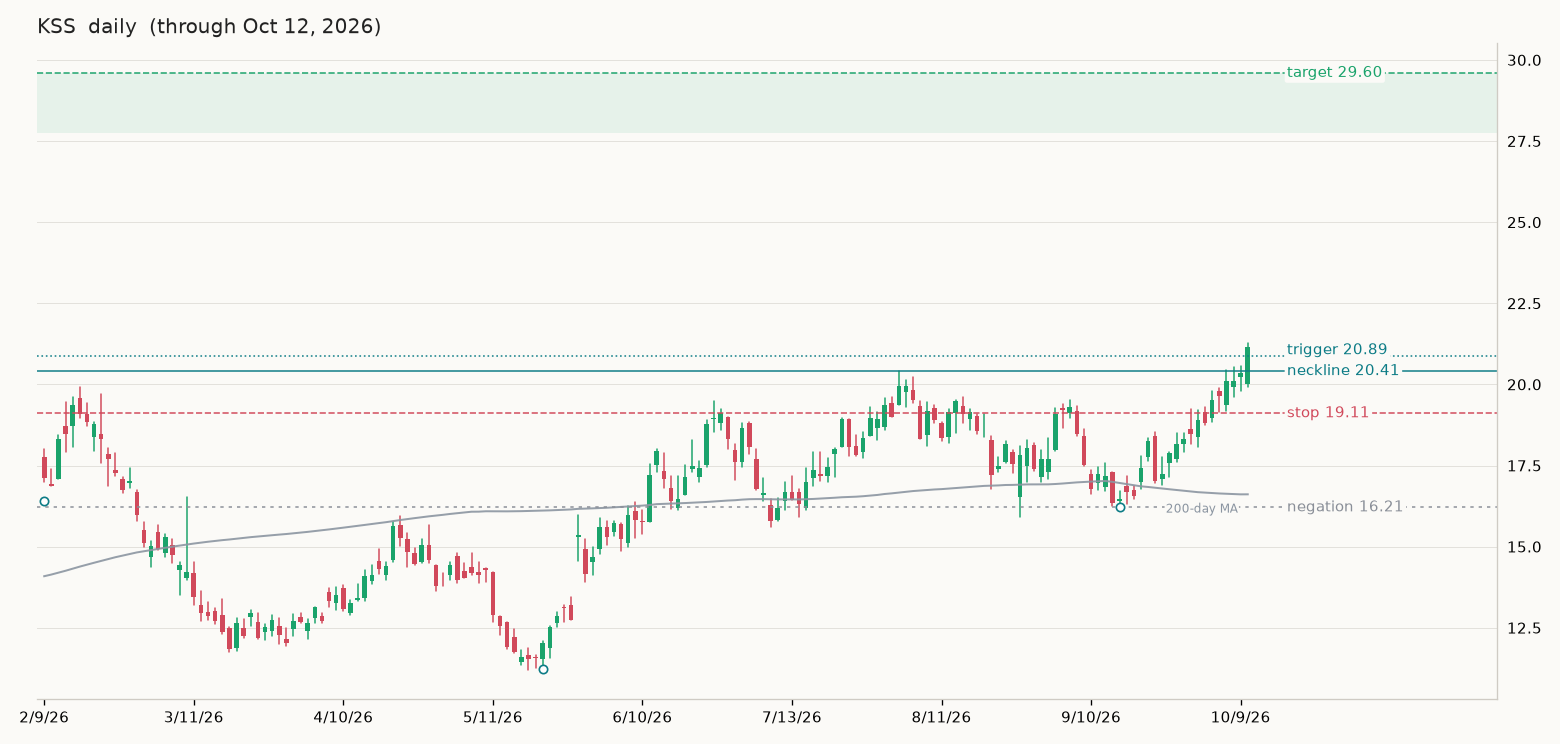
KSS carried an inverse head and shoulders with the neckline at 20.41. In the first week of October it pressed the line three days running: October 7 traded up to 20.44, October 8 to 20.54, October 9 to 20.56, and closed under the line each time. On Monday, October 12 it closed at 21.17, the first close over 20.41 and past the 20.89 trigger.
Walk back from October 12. The 9th, 8th and 7th all poked above 20.41, so none of them was entirely inside the pattern. The 6th was: high 19.89, low 19.15, close 19.63. That is the last full day. The stop is 0.2% under its low, 19.11, and it is the stop the letter printed the night of the breakout. It does not depend on what the breakout day did.
From the trigger of 20.89 that is 1.78 of risk against a measured target of 29.60, about 4.9 to 1. From the breakout close of 21.17 it is 2.06 of risk, about 4 to 1. The three intraday pokes above the line are the whole reason the stop sits where it does; a percentage stop would have ignored them.
What the rule does not do
- It does not tell you when to take profit. That is the measured move and the trailing rules, which are separate.
- It does not protect against a gap through the stop. No stop does.
- It does not make every breakout work. Bulkowski's figures for the patterns we scan put failures around one in ten in bull markets. The rule makes the failures cheap, not rare.
Where it comes from
Brandt set out the rule in Diary of a Professional Commodity Trader (2011) and has refined it in his Factor letters since. Kibar's weekly work on global equities is the clearest running demonstration of the plain version. The full list of rules we use, with each author credited, is on the How the scan works page, and the two patterns it is applied to most are explained on the inverse head and shoulders and double bottom pages.
Questions
What if the breakout day gaps far above the line?
The stop is still under the last full day inside the pattern, which may be well below the entry. If the risk is too large for the position size you want, the answer is a smaller position, not a closer stop.
What if there were weeks of days poking above the line?
Then the last full day inside is weeks back and the stop is wide. That is the rule telling you the line was not clean. Most such names fail the scan's own tests before they reach the letter.
Can I use a percentage stop instead?
You can, but a fixed percentage treats a utility and a biotech the same and ignores where the pattern actually held. The Last Day Rule uses the stock's own bars.
When does the stop move up?
Our ladder, after Brandt and Kibar: breakeven at one times the initial risk, a trailing stop at two times, and the measured target as the place to take or trail. The initial stop itself never moves down.