
FinVigilante
Know which charts are worth watching before the bell, with the exact levels.
After every close, about 2,000 US stocks are scanned by rules. Inverse head and shoulders, rectangles, triangles, breakouts and re-tests, each with its line, trigger, stop and target. In your inbox before the open.
What a member sees
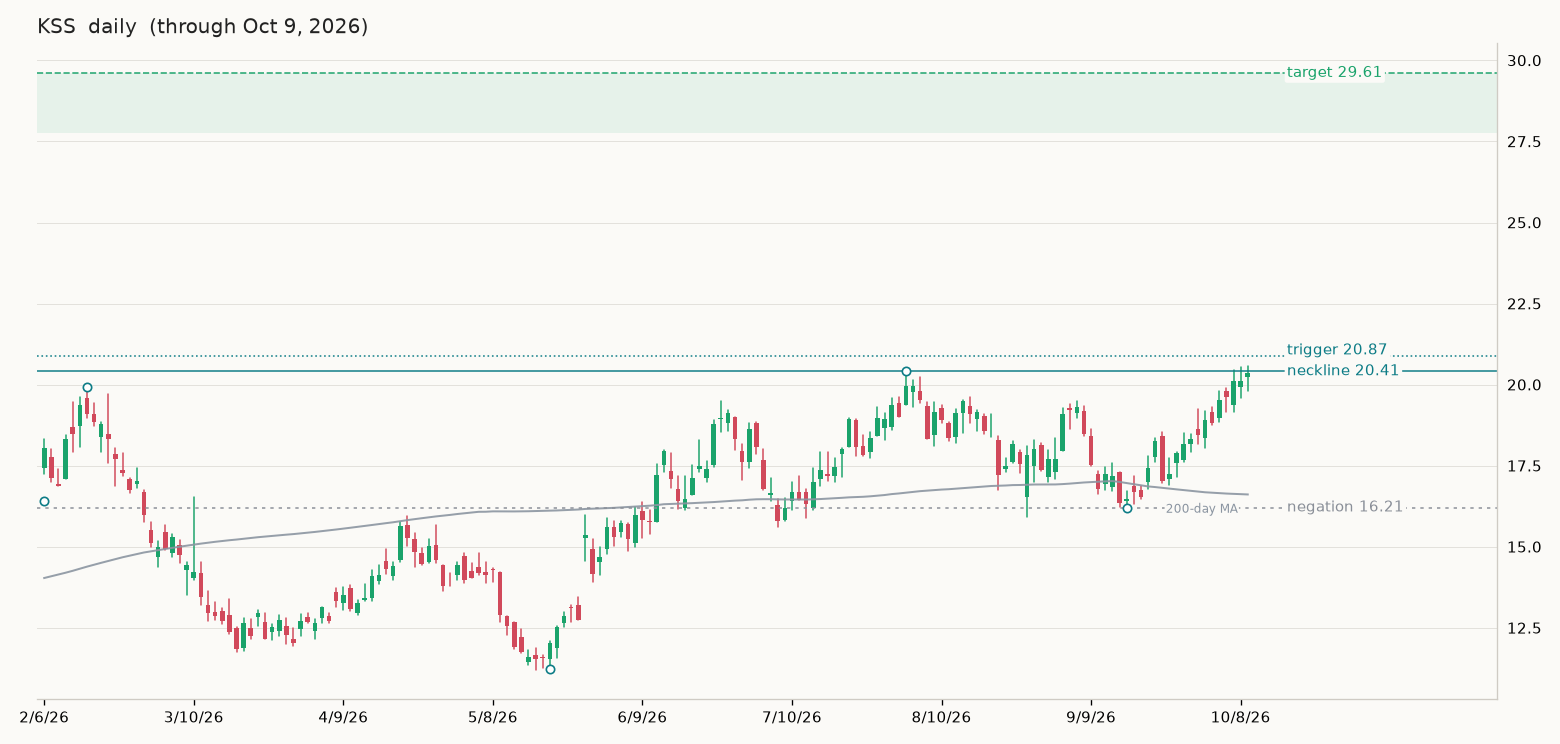
Show daily chart
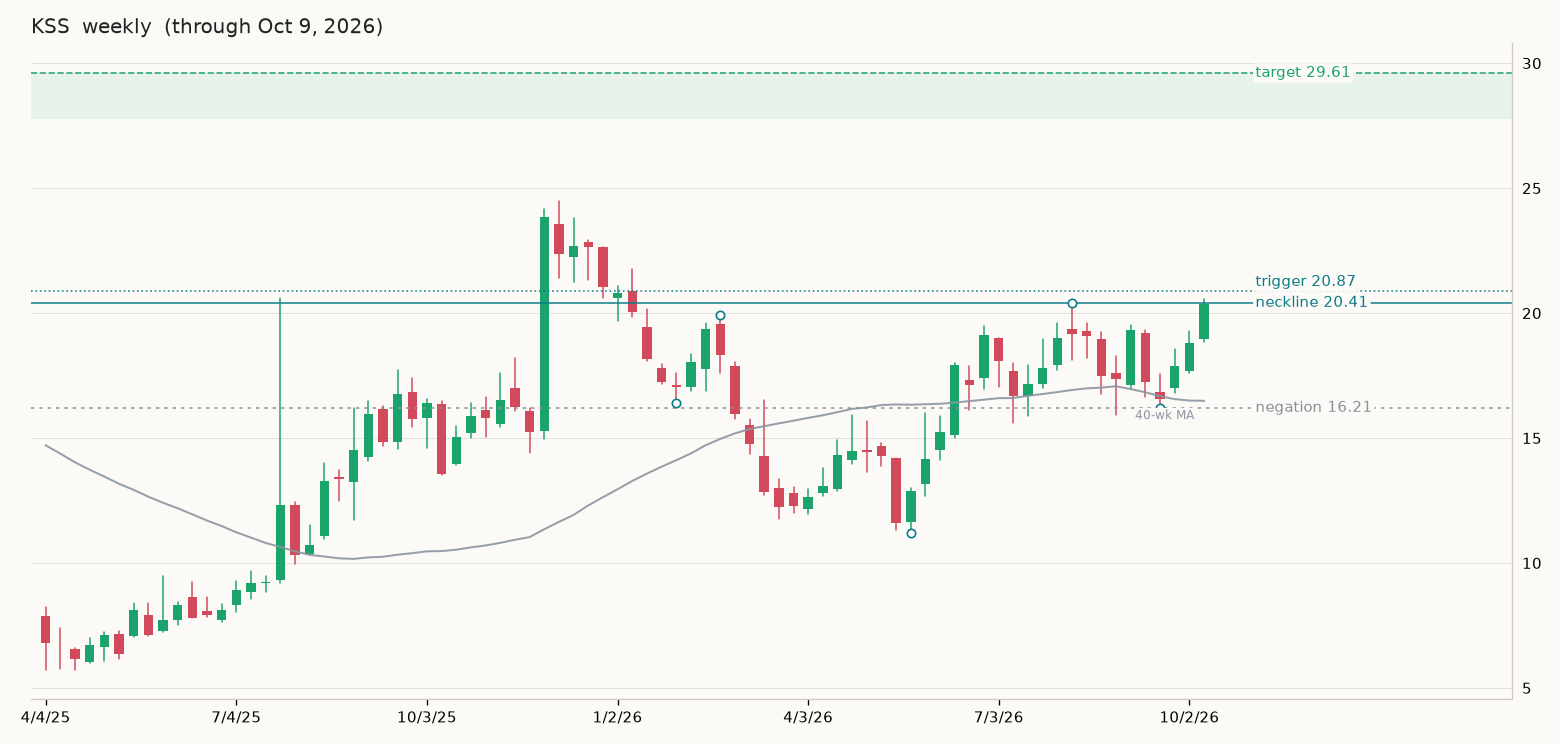
Kohl's Corporation, department stores, $2.3B. Earnings Nov 24 (in 32 sessions) 33-week bottom inverse head and shoulders.
One name from a nightly post, exactly as it appears. Every setup gets a weekly chart for the shape, a daily chart for the entry, the company line, and the levels. Nothing is drawn by hand.
The list remembers
Each night opens with what changed since the last one. Confirmations, targets reached, negations with the level that broke, removals with the reason. On Sundays the recap shows how the week's setups resolved, and it is free, whether or not it flatters us.
Confirmed tonight: TEVA (base breakout, close 41.62 over 41.44).
New on the list: E (inverse head and shoulders), HHH (double bottom).
Negated: TARS (closed under 72.76, pattern failed).
Removed: PYPL (trigger is 6 sessions old), AZTA (re-test went through the level).
How a night works
- 4:00 pm ET
Market closes. Final daily bars come in for about 2,000 US stocks.
- 6:15 pm ET
The scanner runs five patterns against every bar it has: inverse head and shoulders, rectangles, ascending triangles, breakouts over a prior high and pullbacks to a breakout level. Every level is set by code.
- Evening
A trader reads the list, cuts anything that does not look right and can correct how a pattern was read. Nothing is added by hand.
- Before the open
The post goes to paid members, with what changed at the top.
What we mean by a setup
A pattern is a stretch of time where buyers and sellers fought to a standstill inside a boundary. The line is that boundary. The trigger is a close half an average true range past it, so a utility and a biotech are held to the same standard. The stop is the low of the last day inside the pattern, Brandt's Last Day Rule, and it does not exist until the breakout does. The target is the measured move. The negation level is where the pattern is simply wrong. The whole method, with its sources, is one page.
What it costs
| Free | Setups $10 a month or $80 a year | |
|---|---|---|
| Sunday recap: the week's confirmations, targets and negations | Yes | Yes |
| Three names closest to a breakout, with charts | Yes | Yes |
| The full list, after every market close | Yes | |
| Trigger, stop, target and negation on every name | Yes | |
| Weekly and daily charts for every setup | Yes | |
| What changed since last night | Yes | |
| Subscribe freeFree | Join SetupsJoin |
Cancel any time from your account page. Not investment advice; read the disclaimer.
Questions
Is this investment advice?
No. It is general technical analysis sent to every paid member on the same schedule, not tailored to anyone.
How many setups per night?
However many pass the rules. It varies with the market: a quiet week might give two or three, a strong one more than ten. There is no padding to hit a number.
Where do the rules come from?
Edwards & Magee, Weinstein, O'Neil, Minervini, Bulkowski, Brandt and Kibar, each credited for the specific rule on the How it works page.
Which timeframe are the charts on?
Both. Inverse head and shoulders, rectangles and ascending triangles are found on weekly bars, and breakouts and re-tests on daily bars. Every setup is published with a weekly chart to show the shape and a daily chart to time the entry, and you can switch between them with one click.
Can I cancel?
Any time. You keep access through the period you paid for.