A Guide to Technical Analysis on Financial Markets


What is Technical Analysis?
Technical analysis examines financial market movements to predict future price trends. It is a form of analysis used by traders to help them make informed decisions about when to buy and sell assets. Technical analysis does not rely on fundamental factors such as company earnings or economic indicators. Instead, it focuses on reading the trends of buyers and sellers to make predictions about future prices.
Most analysts believe that by studying past price trends, they can predict how the market will move next. Technical analysis is similar to looking at a scoreboard while playing a game; you can see what has happened previously to predict the next outcome.
If you were studying a scoreboard and noticed that one team was consistently coming out on top, you would predict that this team would continue to win. Like in a game, there are patterns in financial markets that tell us what is likely to happen next with prices.
The critical thing with technical analysis is determining where the market is in relation to these patterns. If the market moves within a pattern, the trend will likely continue. If the market has broken out of a pattern, then it is likely that a new trend has begun.
How Does Technical Analysis Work?
Technical analysis works by analyzing the price movements of an asset over time. It is done by looking at the asset's chart and identifying patterns. Once these patterns have been identified, the analyst will attempt to predict where the market is likely to go next.
Several different technical analysis techniques are used, but most analysts use a combination of them to form a complete picture.
Asset Classes in Financial Markets
Traders tend to focus on particular asset classes when using technical analysis. It is impossible to study all the different types of financial markets at once because there are many thousands. The most common asset classes analyzed include stocks (long and short term), futures (including forex), commodities, and cryptocurrencies.
Studying these different types of markets makes it possible to understand what is happening in financial markets at once. Technical analysis can then determine which asset class has the best chance of generating profit in the future. This knowledge can benefit traders because most assets tend to move in the same direction.
5 Crucial Trends in Technical Analysis for Technical Analysis
Support and Resistance
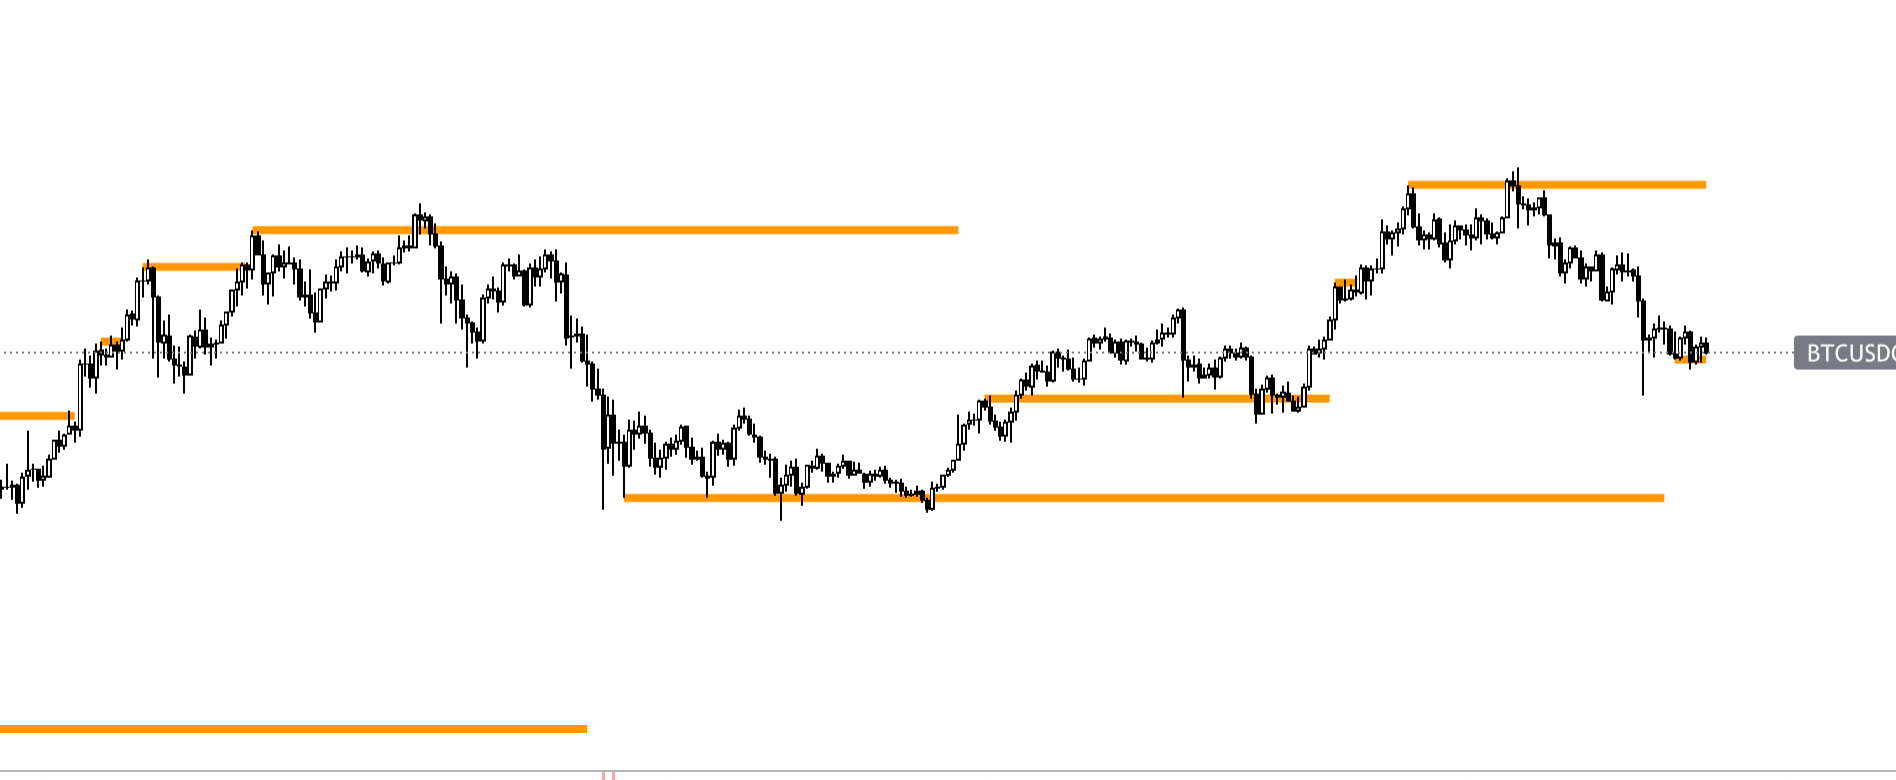
Support and Resistance are probably the most important concepts to understand about Technical Analysis. They are represented by drawing horizontal lines on a chart and represent where buyers and sellers trend in the past.
Support is found when a stock falls to a specific price and then bounces back up; this happens when buyers enter the market and push the price back up. Resistance is found when a stock rises to a specific price and then falls back down; it usually happens when selling pressure dominates the market and pushes the price back down.
Trend Lines in Financial Markets
Trend lines help to identify the trend of an asset. An uptrend line develops when a financial asset makes higher highs and higher lows. A downtrend line forms when the financial asset makes lower highs and lower lows and can help traders to get an idea of where the price is likely to go next.
Patterns
Technical analysts will often attempt to understand the market's future direction by looking at past price movements. The most common patterns used include the Flag, Head and Shoulders, Double Top or Double Bottom, Cup and Handle, Rectangle patterns, to mention a few. You can find many of these patterns on a candlestick chart.

Fibonacci Retracement Levels
Fibonacci Retracement is a technical analysis tool to identify potential support and resistance levels. The levels are created by finding the high and low of an asset's price movement, dividing it by key Fibonacci ratios, and extending the Fibonacci sequence.
Indicators
Indicators are technical analysis tools to help identify trading opportunities and are often used as buy and sell signals. Examples of indicators include MACD, Stochastic Oscillator, or RSI.

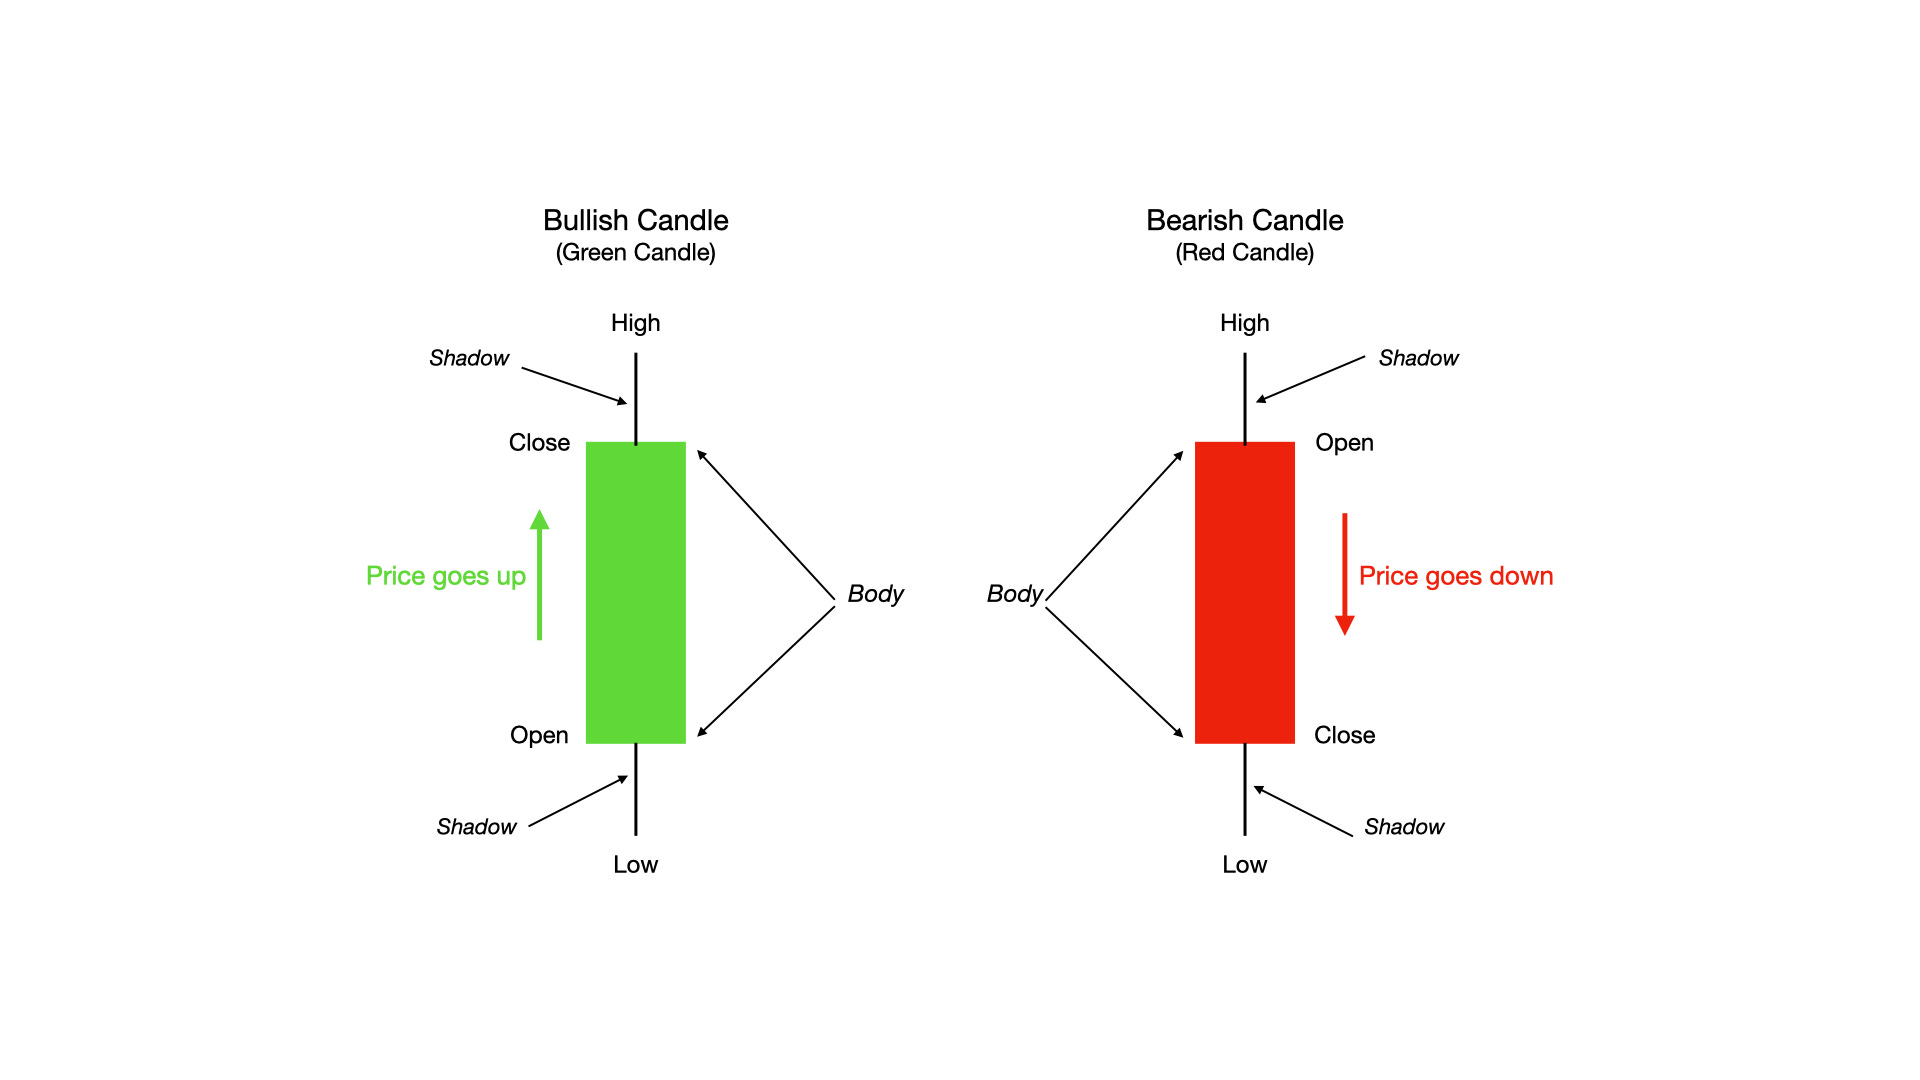
Candlestick Charts
Candlestick charts visually represent the price movement and have been used for hundreds of years. You will see in a candlestick chart the open, the close, the high, and the low of the price within a fixed period. A candle looks like a real candle because it has a thin vertical line representing the opening price and a small horizontal line at the bottom representing the closing price.
The length of these two lines varies depending on how volatile the market is. If the opening and closing prices are far apart, this would indicate a significant increase or decrease in prices during that period.
The candle patterns are the most important thing to look for when reading a candlestick chart. These patterns form due to the price movement and could indicate where the market is likely to go next. Many candle patterns exist, and traders use different combinations to make trading decisions.
The Future of Trading with AI Advances in Machine Learning and Deep Learning Algorithms.
Technical analysis keeps evolving day by day. With improvements in machine learning and deep learning algorithms, traders will soon have access to more sophisticated tools that will help them make better trading decisions. These tools adapt to the ever-changing market conditions, which will give traders an edge over other traders.
The evolution of trading includes machine learning algorithms used for various applications ranging from mutual funds to algorithmic trading. Deep learning algorithms develop predictive models for financial markets to predict prices. Such technologies will help the traders improve their performance and make profits in the markets.
Disclaimer: The nature of trading and investing in any assets is risky and can lead to capital losses. Our content is meant for informational purposes and should never be considered as financial advice.